
Oct 12, 2020 | Medical Billing Software Blog, Partner, Revenue, Waystar
Today’s healthcare landscape faces truly unprecedented challenges, which means it’s more important to get the most out of your analytics to develop more informed, strategic decisions. There’s a deep well of data that each revenue cycle feeds into, which if properly analyzed, can help organizations operate at their most efficient and effective. Here are the four stages of data analytics workflows that are key to developing those actionable insights: A “Trigger,” or the point in your revenue cycle that sets up the call for deeper analysis; “Interpretation” of data to determine root causes and identify appropriate next steps; “Intervention” to improve specific metrics; and “Tracking” of said metrics to chart success in achieving desired outcomes.
So, let’s examine what a successful version of each stage looks like:
Trigger:
The trigger occurs when you notice something that needs further investigation. With the right analytics tool you can easily access all of your key performance indicators, financial goals and more, providing the visibility you need into your rev cycle. When something looks amiss or needs improving, you can drill down to the level that shows what’s really going on.
Interpretation:
Even a wealth of data amounts to nothing without an efficient way to process and communicate key takeaways. You’ll need to equip your team with access to concise reports, smart visualizations and relevant historical data in order to get them to the insights that drive action.
Intervention:
Now is the time to take action. Intervention is ultimately tied directly to your ability to drill down into the data underlying problematic areas of your revenue cycle and clearly communicate takeaways with your team. Success at this stage depends on designing a plan based on your best understanding of underlying issues and the most effective way to address them.
Tracking:
Your intervention plan is built on KPIs that naturally intertwine with the way you measure success across your revenue cycle. With proper implementation and tracking, running with the analytics cycle can become a simple addition to your everyday workflow. More than delivering on your initial goals, the true power of analytics is the ability to deliver repeat value on your initial investment.
Wrap Up
A strong analytics solution does more than deliver a more fully developed picture of your revenue cycle performance. It provides actionable business intelligence, cuts down on time between analysis and action, and lessens the strain on your IT department.
Waystar is a ‘partner’ of EZClaim, and provides analytics for a practice using their medical billing software. For more details about EZClaim’s products and services, visit their website: https://ezclaim.com/
To learn more about how Waystar can help you harness the power of your data, call their main office at 844-4WAYSTAR, or call sales at 844-6WAYSTAR.
[ Contributed by Waystar ]
Sep 10, 2020 | Electronic Billing, Medical Billing Software Blog, Partner
In the wake of the COVID-19 pandemic, Telehealth adoption has exploded, and there are six revenue cycle metrics to track.
Many patients are prohibited or reluctant to venture out for on-site care. The combination of relaxed regulations and expanded payment parity for appointments has made virtual meetings easier and more attractive for providers, who are turning to these technologies to stay engaged with patients—and maintain cashflow. Dr. Robert McLean, a former president of the American College of Physicians, recently said, “this crisis has forced us to change how we deliver health care more in 20 days than we had in 20 years.”
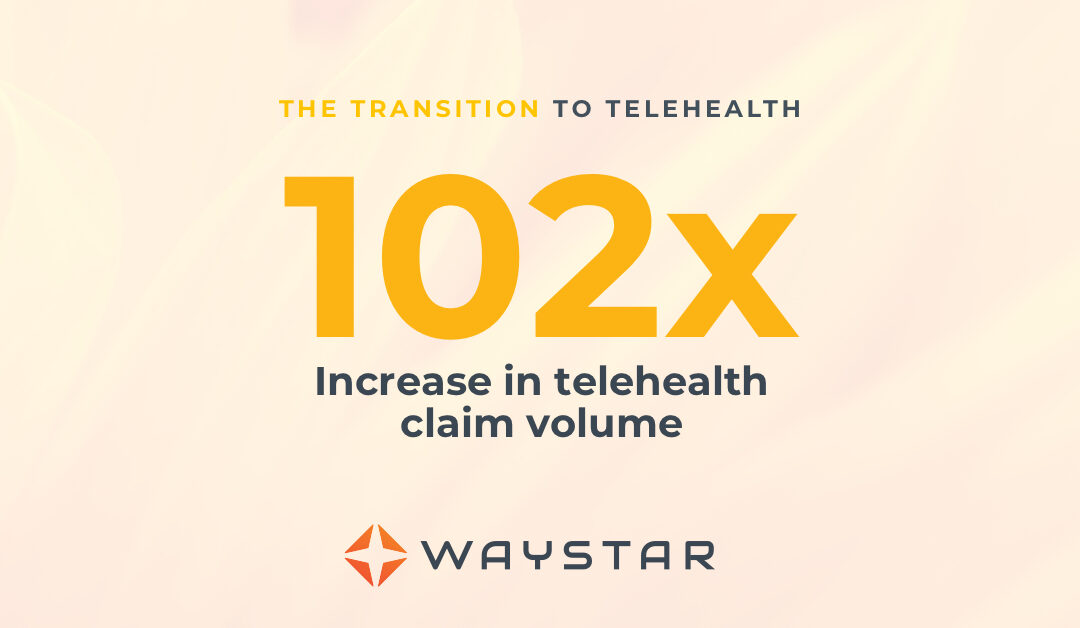
A new industry report predicts that the number of Telehealth visits in the US will surpass one billion by the end of the year, and speculates that nearly half of those visits will be related to COVID-19. At Waystar, we have been closely monitoring claim trends and are seeing this growth firsthand. In fact, the volume of Telehealth claims on the Waystar platform has grown by more than 100 times since mid-March. On two particular days in late April, they accounted for more than 15% of our total daily claim volume. Before COVID-19, they would have accounted for less than one percent!
For many providers, this shift will require new revenue cycle strategies to meet growing patient demand without overwhelming clinicians and administrative teams—or already strained operating budgets. It’s important to remember this is still very much an evolving care delivery model with the opportunity for errors on the part of both payers, providers, and administrative staff. For this reason, revenue cycle professionals should diligently monitor claims to ensure proper adjudication, identify learning opportunities, and uncover areas for operational improvement.
Below, we’ve listed six core Telehealth-related metrics you should regularly track to ensure billing accuracy, maximize payer reimbursement, and reduce claim rejections and denials. For more on how to best navigate the evolving telemedicine landscape, check out our resource hub here.
To report on Telehealth-related claims, you’ll first need to identify and isolate claims containing Telehealth procedure codes. See CMS’ Telehealth code list to identify the specific procedure codes and modifiers that apply to your organization.
Payer Analysis:
1. Payer Telehealth claim rejections by volume and/or billed amount
2. Payer Telehealth claim denials by volume and/or billed amount
If your Telehealth claims are being denied or rejected, do you know which specific payers are doing so at the highest rate? Drill down to discover the specific reason codes payers are attaching to rejections and denials so you can better understand payer-specific rules and avoid these oversights in the future. In some cases, you may identify trends that warrant a call to the payer to correct.
Provider Analysis:
3. Telehealth claim volume by the provider
Review this claim volume by individual provider. If you notice providers within your organization generating a much lower volume of Telehealth claims than peers, perhaps they could benefit from additional training on Telehealth technology and use cases.
Ensuring Billing Accuracy:
4. Telehealth claim rejections by biller/team
5. Telehealth claim denials by biller/team
Are certain billing personnel or teams producing higher denial or rejection rates than others? Keep a close eye on these trends and remember most of this is new for everyone. If some team members are seeing more rejections or denials than they should, it could be a great opportunity to hold training and collaborate on strategies for success.
Maximizing Reimbursement:
6. Telehealth claim volume by procedure code
Which Telehealth codes are you using? Each code reimburses at a different rate, so choosing the wrong ones could leave money on the table. Be sure to read up on CMS’ requirements (check out their fact sheet and code list) to ensure you’re choosing the appropriate code(s) on each Telehealth claim.
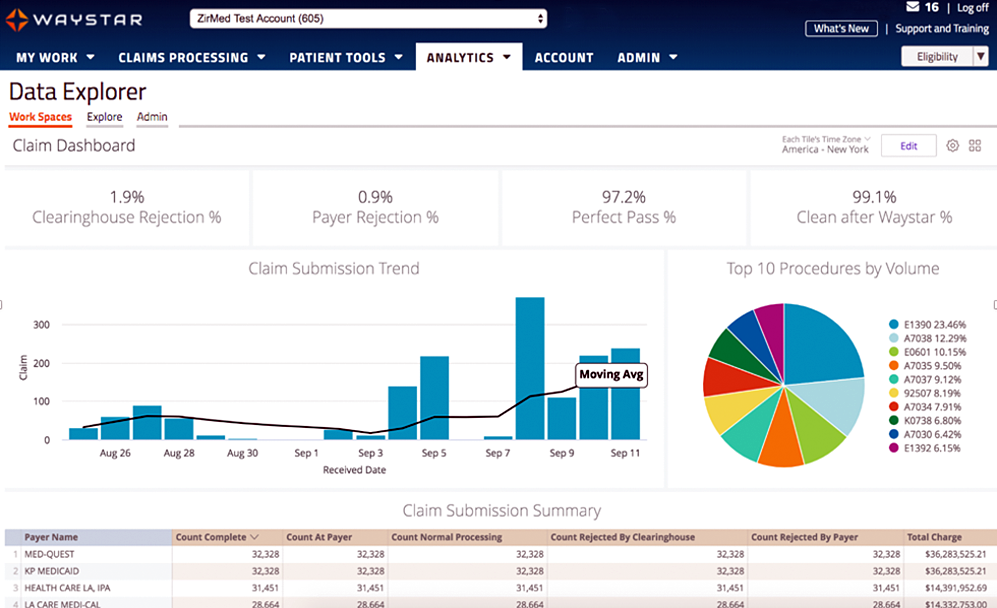
Waystar Analytics
You have all the data you need to drive informed decision making and improve financial performance—you just need the right analytics tool in your corner. Our new Waystar Analytics solution offers a pre-built Telehealth dashboard that can help you easily interpret, share all the metrics above, and track these revenue cycle metrics. Click here to learn more about Waystar Analytics and how it can deliver the insights you need during this time of transition.
[ By Waystar ]